How AnalyzeWise Works: A Step-by-Step Guide
Welcome to AnalyzeWise! This page provides a detailed walkthrough of how our platform helps you transform raw data into actionable insights. We'll break down each stage of the process, from data ingestion to visualization and reporting, so you can understand how AnalyzeWise empowers you to make smarter decisions.
Step 1: Data Ingestion & Connection
The first step is to connect AnalyzeWise to your data sources. We support a wide range of data sources, including:
- Databases (SQL Server, MySQL, PostgreSQL, Oracle)
- Cloud storage (Amazon S3, Google Cloud Storage, Azure Blob Storage)
- Spreadsheets (Excel, CSV)
- APIs (Google Analytics, Salesforce, social media platforms, custom APIs)
Connecting to your data is simple. Within the AnalyzeWise platform, you'll find intuitive connectors for each data source. You will need to provide the necessary credentials (e.g., database username and password, API key) and specify the data you want to import. AnalyzeWise uses secure protocols to ensure your data remains protected during the connection process.

Once connected, you can schedule automated data refreshes to ensure your analysis is always based on the latest information. You can set up daily, weekly, or monthly refreshes, or trigger them manually as needed.
Step 2: Data Preparation & Transformation
Raw data is often messy and needs to be cleaned and transformed before it can be effectively analyzed. AnalyzeWise provides powerful data preparation tools that allow you to:
- Cleanse data: Remove duplicates, handle missing values, and correct errors.
- Transform data: Convert data types, perform calculations, and create new fields.
- Filter data: Focus on specific subsets of data relevant to your analysis.
- Aggregate data: Summarize data to gain a higher-level view.
- Join data: Combine data from multiple sources to create a unified dataset.
Our intuitive drag-and-drop interface makes data transformation easy, even for users without technical expertise. You can also use our expression builder to create custom formulas and calculations. All data transformations are automatically logged, so you can easily track changes and revert to previous versions if needed.
For example, imagine you are analyzing sales data from different regions. You might need to convert currency values to a common currency, standardize date formats, and aggregate sales by product category. AnalyzeWise allows you to perform these transformations quickly and easily, without writing any code.
Step 3: Data Visualization & Exploration
With your data prepared, it's time to explore it visually. AnalyzeWise offers a wide range of interactive charts and graphs, including:
- Bar charts
- Line charts
- Pie charts
- Scatter plots
- Maps
- Heatmaps
- Funnel charts
Simply drag and drop your data fields onto the chart canvas to create visualizations. Our smart chart recommendations engine suggests the best chart types for your data. You can customize the appearance of your charts to match your brand guidelines. Use filters, drill-downs, and cross-filtering to explore your data from different angles and uncover hidden patterns.
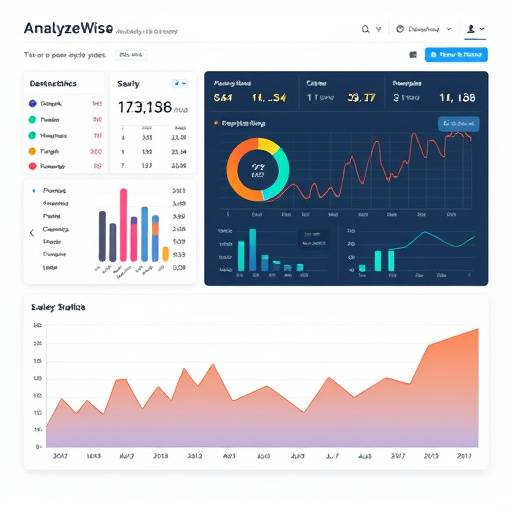
For instance, if you want to analyze website traffic, you can create a line chart to track page views over time, a bar chart to compare traffic sources, and a map to visualize user locations. AnalyzeWise makes it easy to identify trends, outliers, and correlations in your data.
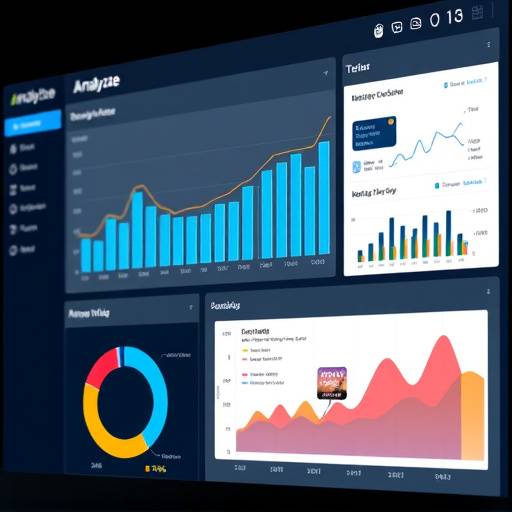
Step 4: Reporting & Dashboarding
Once you've created your visualizations, you can combine them into interactive dashboards. Dashboards provide a central view of your key metrics and KPIs. You can customize your dashboards with your company logo, colors, and branding. Share your dashboards with colleagues and stakeholders, and collaborate on data-driven decisions.
AnalyzeWise also supports scheduled report generation. You can create automated reports that are emailed to your team on a regular basis. Our reporting tools allow you to create professional-looking reports with customizable layouts, headers, and footers.
For example, you can create a sales dashboard that displays total revenue, sales by region, and top-performing products. Or, you can create a marketing dashboard that tracks website traffic, lead generation, and conversion rates. AnalyzeWise empowers you to communicate your data insights effectively and drive action.
Step 5: Predictive Analytics (Optional)
For advanced users, AnalyzeWise offers predictive analytics capabilities. You can use machine learning algorithms to forecast future trends, identify risks, and optimize decisions. Our predictive analytics features include:
- Time series forecasting
- Regression analysis
- Classification
- Clustering
You can build predictive models using our drag-and-drop interface or write custom code using Python or R. AnalyzeWise makes it easy to integrate predictive analytics into your existing workflows.
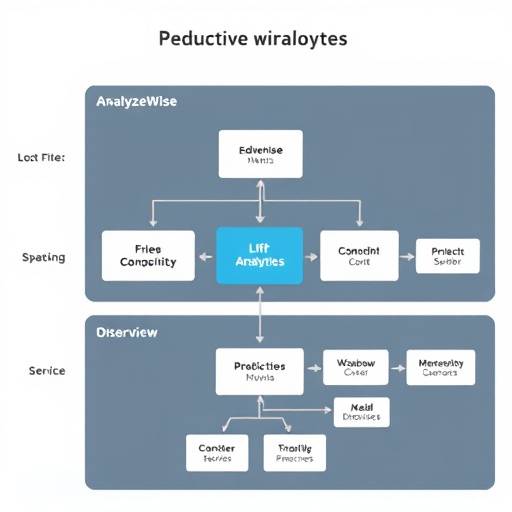
For example, you can use time series forecasting to predict future sales based on historical data. Or, you can use regression analysis to identify the factors that influence customer churn. AnalyzeWise helps you unlock the power of predictive analytics to gain a competitive edge.
Frequently Asked Questions
- What types of data sources does AnalyzeWise support?
- AnalyzeWise supports a wide range of data sources, including databases, cloud storage, spreadsheets, and APIs. See the "Data Ingestion & Connection" section above for a detailed list.
- Do I need to be a data scientist to use AnalyzeWise?
- No, AnalyzeWise is designed to be user-friendly for both technical and non-technical users. Our intuitive interface and drag-and-drop tools make it easy to perform data analysis without writing code. However, advanced users can also use our expression builder and custom code integration features.
- Is my data secure with AnalyzeWise?
- Yes, we take data security very seriously. AnalyzeWise uses secure protocols to protect your data during transmission and storage. We also comply with industry-standard security certifications. Your data is stored in secure data centers with 24/7 monitoring.
- Can I share my dashboards and reports with others?
- Yes, you can easily share your dashboards and reports with colleagues and stakeholders. You can also control access permissions to ensure that only authorized users can view your data.
- How much does AnalyzeWise cost?
- We offer a variety of pricing plans to fit your needs. Please visit our contact page or homepage for more information on our pricing plans.