Data Visualization
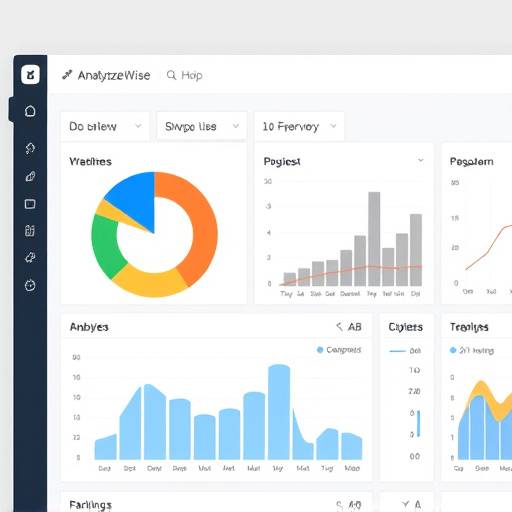
AnalyzeWise offers powerful data visualization tools that transform raw data into insightful charts, graphs, and dashboards. Our platform supports a wide range of visualization types, including bar charts, line graphs, pie charts, scatter plots, heatmaps, and geographical maps. These tools enable users to quickly identify trends, patterns, and outliers within their data, facilitating data-driven decision-making. Interactive dashboards allow for real-time monitoring of key performance indicators (KPIs) and provide a comprehensive overview of business performance.
With AnalyzeWise, you can customize your visualizations to match your brand and specific analytical needs. Easily adjust colors, labels, and annotations to highlight important findings and present data in a clear and compelling manner. Our platform also supports drill-down capabilities, allowing you to explore data at different levels of granularity and gain deeper insights into underlying drivers.
- Interactive Dashboards
- Customizable Charts and Graphs
- Real-time Data Updates
- Drill-down Analysis
- Support for Various Data Sources
- Automated Reporting
User Insights
Understand your users like never before with AnalyzeWise. Our user insights feature provides a comprehensive view of user behavior, preferences, and engagement patterns. Track user interactions across your website, application, or platform to identify areas for improvement and optimize the user experience. Analyze user demographics, interests, and purchasing behavior to personalize marketing campaigns and drive customer loyalty.
AnalyzeWise employs advanced analytics techniques, such as cohort analysis and segmentation, to uncover valuable insights about different user groups. Identify high-value users, understand their needs, and tailor your offerings to maximize customer satisfaction. Our platform also includes tools for sentiment analysis, allowing you to gauge user sentiment towards your brand and address any concerns proactively. Data privacy is paramount; all user data is handled with the utmost care and in compliance with relevant regulations, like GDPR.
- User Behavior Tracking
- Cohort Analysis
- Segmentation
- Sentiment Analysis
- Personalized Marketing
- Customer Journey Mapping
Performance Tracking
Monitor your key performance indicators (KPIs) and track progress towards your business goals with AnalyzeWise. Our performance tracking feature provides a centralized dashboard for monitoring critical metrics, such as sales, revenue, customer acquisition cost (CAC), and return on investment (ROI). Set targets, track progress over time, and identify areas where performance is lagging. Receive automated alerts when KPIs deviate from expected levels, enabling you to take corrective action promptly.
AnalyzeWise supports a wide range of performance metrics, allowing you to track the indicators that are most relevant to your business. Customize your dashboards to display the metrics that matter most to you and share them with your team to promote accountability and transparency. Our platform also includes tools for benchmarking your performance against industry standards, helping you identify opportunities for improvement and stay ahead of the competition.
- KPI Monitoring
- Target Setting
- Progress Tracking
- Automated Alerts
- Benchmarking
- Customizable Dashboards
Analytics Tools
AnalyzeWise provides a comprehensive suite of analytics tools to help you unlock the full potential of your data. Our platform includes tools for data mining, statistical analysis, predictive modeling, and machine learning. These tools enable you to uncover hidden patterns, identify trends, and make data-driven predictions about future outcomes. Whether you're looking to forecast sales, predict customer churn, or optimize marketing campaigns, AnalyzeWise has the tools you need to succeed.
Our analytics tools are designed to be user-friendly, even for those without a background in data science. Drag-and-drop interfaces and intuitive workflows make it easy to perform complex analyses without writing a single line of code. For advanced users, AnalyzeWise also supports integration with popular programming languages, such as Python and R, allowing you to leverage your existing skills and tools. The advanced tools offer features like A/B testing, regression analysis, time series forecasting, and clustering.
- Data Mining
- Statistical Analysis
- Predictive Modeling
- Machine Learning
- A/B Testing
- Regression Analysis
- Time Series Forecasting
- Clustering
Integrations
AnalyzeWise seamlessly integrates with a wide range of popular data sources and applications. Connect to your CRM, marketing automation platform, social media accounts, and other data sources to centralize your data and gain a holistic view of your business. Our platform supports both cloud-based and on-premise data sources, giving you the flexibility to connect to the data wherever it resides.
Our integrations are designed to be easy to set up and maintain. Simply enter your credentials for the desired data source, and AnalyzeWise will automatically pull in the data and keep it updated in real-time. We also offer a robust API, allowing you to build custom integrations with your own applications and systems.
- CRM Integration
- Marketing Automation Integration
- Social Media Integration
- Cloud-based Data Source Integration
- On-premise Data Source Integration
- API for Custom Integrations