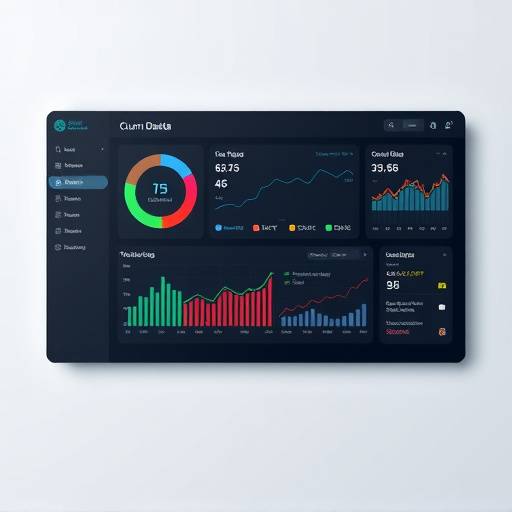
Understanding Customer Churn Through Data Visualization
Published by Anya Sharma on October 26, 2024
Customer churn is a critical metric for any business. It represents the rate at which customers stop doing business with a company. High churn rates can significantly impact revenue and profitability. This article explores how data visualization techniques can provide valuable insights into understanding and mitigating customer churn. We delve into the different types of visualizations, such as cohort analysis, churn prediction charts, and interactive dashboards, to identify patterns, trends, and the root causes of churn. Learn how AnalyzeWise can empower you to proactively address churn and improve customer retention.
Read More
![Graph displaying the correlation between marketing spend and website traffic, showcasing the effectiveness of different marketing channels.]()
Optimizing Marketing Spend with Analytics
Published by Ben Carter on October 20, 2024
In today's competitive landscape, it's essential to maximize the return on your marketing investment. Analytics provides the tools to track, measure, and optimize your marketing campaigns. This article focuses on how to leverage data analytics to make informed decisions about marketing spend allocation. We cover topics such as attribution modeling, A/B testing, and customer segmentation to understand which channels and campaigns are most effective at driving conversions. Discover how AnalyzeWise helps you gain a deeper understanding of your marketing performance and achieve a higher ROI.
Read More
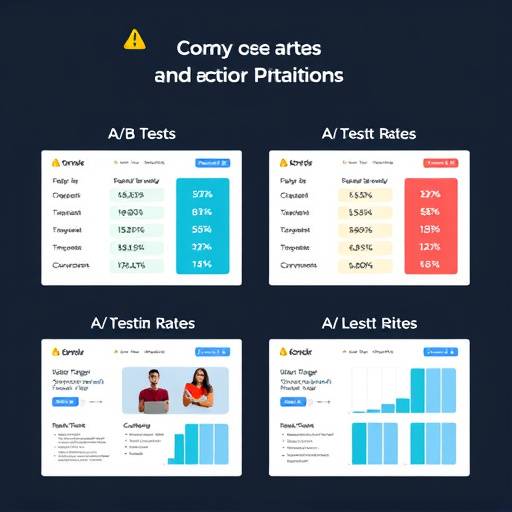
The Power of A/B Testing in Data-Driven Decision-Making
Published by Chloe Davis on October 14, 2024
A/B testing, also known as split testing, is a powerful methodology for making data-driven decisions. By comparing two versions of a webpage, email, or other marketing material, you can determine which performs better. This article explores the fundamentals of A/B testing and its applications in various business scenarios. We discuss how to design effective A/B tests, analyze the results, and implement changes based on the data. Explore how AnalyzeWise makes A/B testing seamless and enables you to make informed decisions that drive growth.
Read More
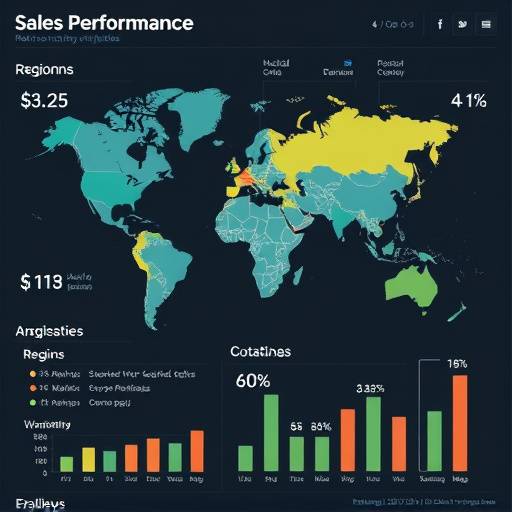
Geospatial Analytics: Unlocking Location-Based Insights
Published by David Evans on October 8, 2024
Geospatial analytics is a powerful tool for understanding location-based data and making informed decisions. This article explores the applications of geospatial analytics in various industries, including retail, logistics, and real estate. We delve into techniques such as mapping, spatial statistics, and location intelligence to identify patterns, trends, and opportunities. Discover how AnalyzeWise helps you visualize and analyze geospatial data to gain valuable insights and optimize your business operations.
Read More

Demystifying Data Science: A Beginner's Guide
Published by Emily Flores on October 2, 2024
Data science has become a buzzword in recent years, but what does it really mean? This article provides a comprehensive introduction to the field of data science, covering the key concepts, techniques, and tools. We explore the data science process, from data collection and cleaning to modeling and visualization. Whether you're a business professional or a student, this guide will provide you with a solid foundation in data science. Learn how AnalyzeWise empowers you to leverage data science for smarter decision-making.
Read More